
How to use Six Sigma in Data Quality improvements.
- Maciek Lasota

- Apr 13, 2021
- 4 min read
DMAIC can be a useful framework in the Data Governance program.
We are hearing everywhere about the high importance of data. We call even call it the new oil. As we are living in a data-driven age we need to know how to keep up with data trends and maintain a certain quality that allows using it. Once we understand the purpose, we need to start with Data Quality Improvements Program.

Key to having high data quality in organizations are awareness and bulletproof processes. Here well` focus on the second one. When thinking about processes the DMAIC cycle can be very handy, this Six Sigma framework is indeed designed for process improvement. DMAIC is a data-driven improvement cycle designed to be applied to business processes. Implemented in your organization will let you find flaws or inefficiencies – particularly resulting in output defects – and combat them. The goal is to improve, optimize, or stabilize existing processes.
It sounds very much suited to help with data quality and indeed it is. It can help improve data management processes and with finding "defects" in data entries. The framework itself is consistent with 5 steps that will guide you toward trustworthy data:

1. Define - Start with defying the business needs. Look for main stakeholders that are impacted by data quality - They can be Functions, Divisions, Programs, etc. (example - Sales Marketing, HR, Legal)
Make connections and talk to them and get to know what data elements they are using in their processes. Create surveys and schedule interviews. Your goal here is to find out what is relevant so you don`t end up creating a bunch of metrics and reports that no one cares about. Identify data management processes and data flows - put them on the map.
Look for problems to solve and high-impact improvement opportunities using design thinking methodologies like emphasizing and ideation. Send out surveys and schedule interviews.
Output: Identified Opportunity Measure - Try describing the process with numbers, collect data and Perform data profiling activities aligning them with Data Quality dimensions. Get results ( depends on your organization's maturity but to start focus on data compliance consistency and uniqueness). Use numbers, not just empty thesis. You can read on how to setup data quality dashboard
For example you : 10 % of your Customers are duplicates. 20% of your Customers postal codes are having a valid format
Try to plot the number and show correlations,
Build a business case here and show what can be the benefit - it can be reports accuracy, waste reduction, or regulatory compliance. Estimate how much poor data quality can cost in maintenance or fines.
Output: Process performance measurements
Analyze - Data management process should able to produce results meeting minimum data quality requirements. This is where you should evaluate results. Use processes maps, data flows, sources, identified entry points, and based on it perform root cause analysis here are some helpful techniques :
5Whys
This is a very simple technique to get you started. The basic concept is to ask “why?” five times to dig deep into the root of a problem. The logic behind it is that in the first few questions you will find one of the causes of the problem, and by the 5th question you will see the process failure behind that problem. This example from Wikipedia covers it pretty well:
The vehicle will not start. (the problem statement)
Why? – The battery is dead. (First why)
Why? – The alternator is not functioning. (Second why)
Why? – The alternator belt has broken. (Third why)
Why? – The alternator belt was well beyond its useful service life and not replaced. (Fourth why)
Why? – The vehicle was not maintained according to the recommended service schedule. (Fifth why is a root cause)
Fishbone diagram - Ishikawa diagram
It shows a much more holistic view of the situation than 5whys. It`s a highly visual and brainstorming technique that sparks further examples of the root causes. The problem is shown as fish head on the right with ale the causes extending to the left as fishbones with sublevels.
Pareto chart
Pareto principle is widely known. The purpose of this exercise is to discover which variations have the highest impact on our output. This technique is more about putting weights on variables than finding potential root causes, the Pareto Chart allows us to prioritize which root causes themselves. It shows which variation you should tackle first to have the greatest impact and which are not worth the effort.
Here’s the Six Sigma Institute’s example Pareto Chart.
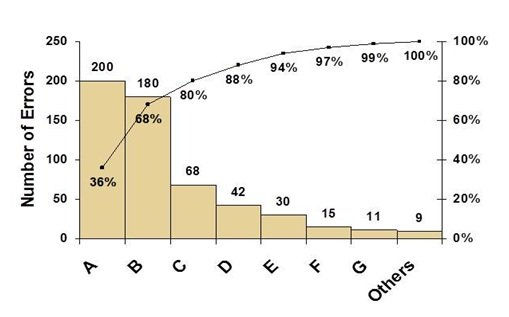
The goal of Pareto is not to find X`s but to find the right X. It represents the most common sources of defects the highest occurring type of defect, or the most frequent reasons for customer complaints, Ask yourself a question what are possible sources of variations. Look at historical data to discover determining factors Identify which processes or feeding systems are creating most of your garbage records. Define goals Output: Problem statement and Identified Key variables
Improve - Once you identify weak chains in the process investigate how they affecting the results and find out how can they be fixed. Try going for low-hanging fruits and quick wins using value vs effort approach. Depending on organization maturity processes can be fixed by simple tweaks like data entry validation in user interface applications. More complicated can use something like elastic search or data deduplication or even projects implementing new master data tools and processes.
The main steps are:
- Brainstorm and Designing solution
- Determine expected results
- Plan and Implement solution
Output: Implemented solution. Predicted and tested results
Control - Fixing the problem it`s not the final step. Keep on monitoring your data to ensure that improvements are implemented and maintained.
Create Data Quality Indicators that will monitor your data regularly and react to any concerning variations. Control and trust the process to confirm that your changes can be sustained.
- Verify reduction in failures due to problem statement
- Determine if additional improvements are needed
- Lesson learned Output: Performance monitoring, Stability Plan
Now Trust the process and you can start the cycle again by looking for the next opportunity for improvement. If you are lost at data quality measurements, following DMAIC steps can help organize your project and harmonize the efforts of data cleansing initiatives in the organization. It`s a solid framework that can point you in the right direction and give an understanding of a high-level plan in your data quality journey.


Comments